Economic Dashboard
Connecticut aims to attract and grow businesses, broaden the base of skilled workers, and create equitable economic opportunities. The indicators included below can offer insight into the state's strengths, opportunities for improvement, and how broader economic trends impact Connecticut businesses and residents.
Business and Workforce
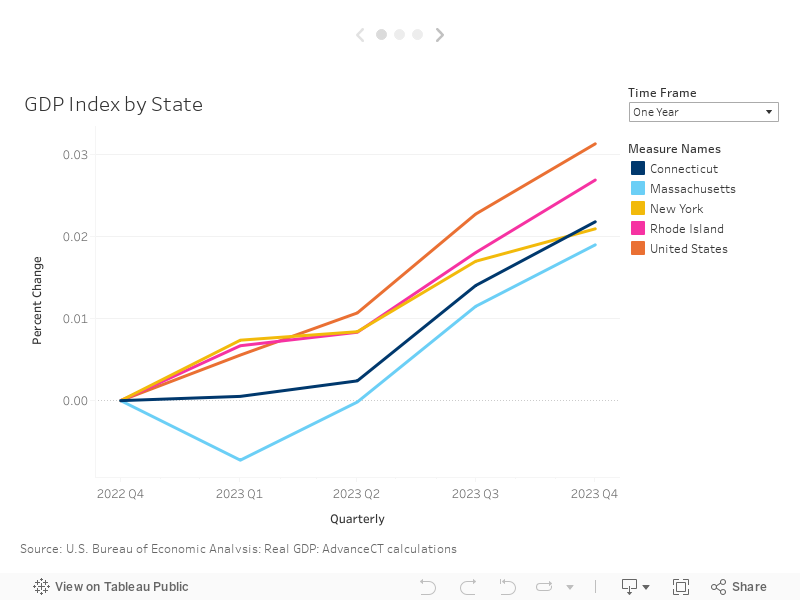
GDP
Connecticut has demonstrated significantly improved economic performance in recent years, after several years of slower growth. In the most recent 4 quarters (through Q4 2023), Connecticut achieved a GDP growth rate of 2.18% YoY. This growth has allowed Connecticut to outpace regional competitors such as Massachusetts and New York, although slightly lagging Rhode Island and the nation overall. When we look at annual growth (2022 annual GDP to 2023 annual GDP), CT’s 2.1% growth rate was best in New England and second best in the Northeast. Furthermore, Connecticut's rank as 6th in the U.S. for GDP per worker reflects its efficiency and productivity.
The state's economy is buoyed by strong 5-year growth in key sectors: Arts, Entertainment, and Recreation (up 43.01%), Information (5th largest industry, up 31.71%), and Management of Companies and Enterprises (up 19.57%), showcasing its innovative and diverse economic base. Despite downturns in Construction, Other Services, and Military, Connecticut's overall economic direction is positive. These strategic growth areas emphasize the state's adaptability and potential for continued development.
Data Published: March 29, 2024
Next Release: June 28, 2024
Jobs
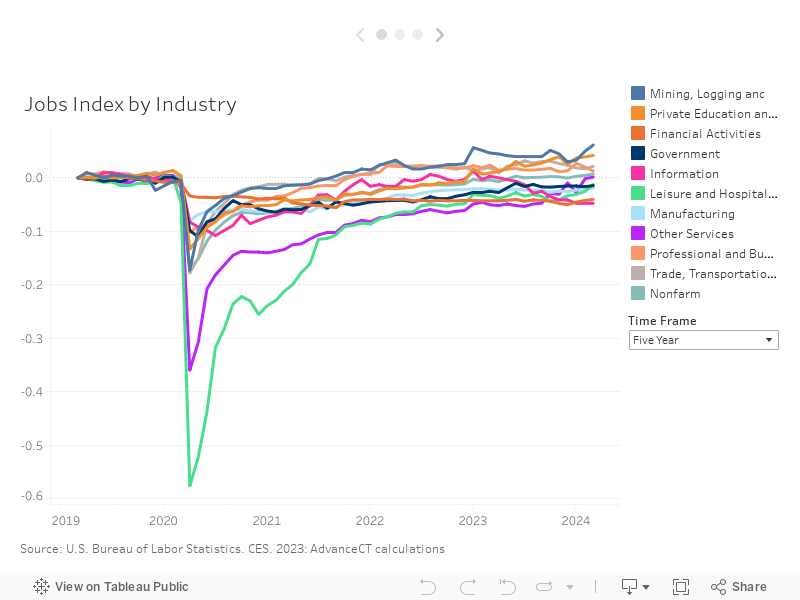
Connecticut showed strong job growth in March with a seasonally adjusted gain of 4,900 jobs led by 4,400 jobs in the private sector. Total Private sector jobs now total 1,475,600 jobs, the highest since 2008. Job gains in January were led by 1,300 jobs in Trade, Transportation and Utilities and 2,100 jobs in Leisure and Hospitality.
Over the past year, job gains were led by Private Education and Health Services (+11,400 jobs), Other Services (+3,400 jobs), and Leisure and Hospitality (+3,300 jobs). Meanwhile, job losses were seen in Information (-1,600 jobs) and Professional and Business Services (-2,400 jobs).
Over the five year period, Private Education and Health Services have led job growth (+14,600 jobs) followed by Trade, Transportation and Utilities (+6,300 jobs) and Construction (+3,700 jobs). Job losses during that time were concentrated in Financial Activities (-5,000 jobs), Leisure and Hospitality (-1,900 jobs) and Government (-3,400 jobs).
Data Published: April 19, 2024
Next Release: May 17, 2024
Labor Force and Unemployment
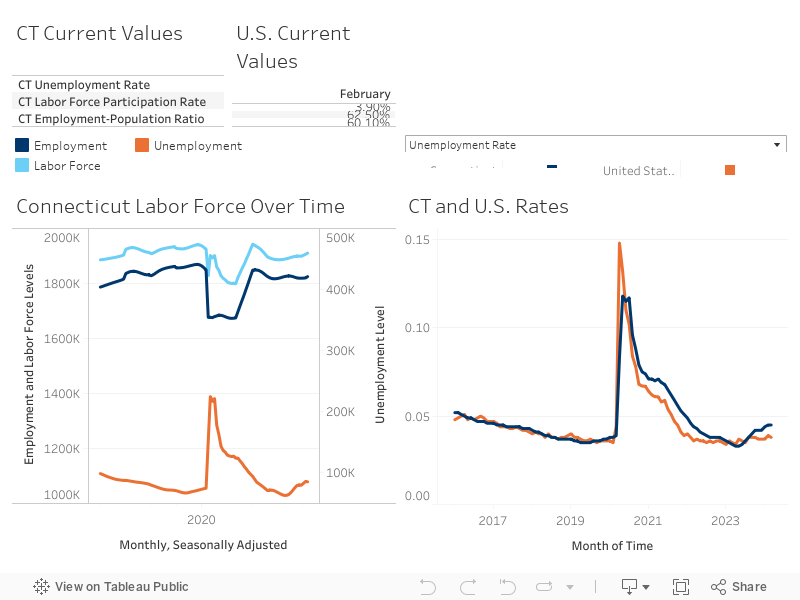
Connecticut’s Labor Force Participation Rate (LFPR) remains higher than the nation overall with a rate of 64.6% compared to 62.7% nationally in March. While the gap between the US and CT LFPR has narrowed in recent years, the gap has expanded again in recent months, with the national rate declining 0.1% since August compared to a 0.3% increase in CT.
March saw an uptick in the unemployment rate in CT to 4.5%. Overall, the unemployment rate in CT is elevated relative to the national rate of 3.8%. This is at least in part due to rising labor force participation relative to the nation.
Data Published: April 19, 2024
Next Release: May 17, 2024
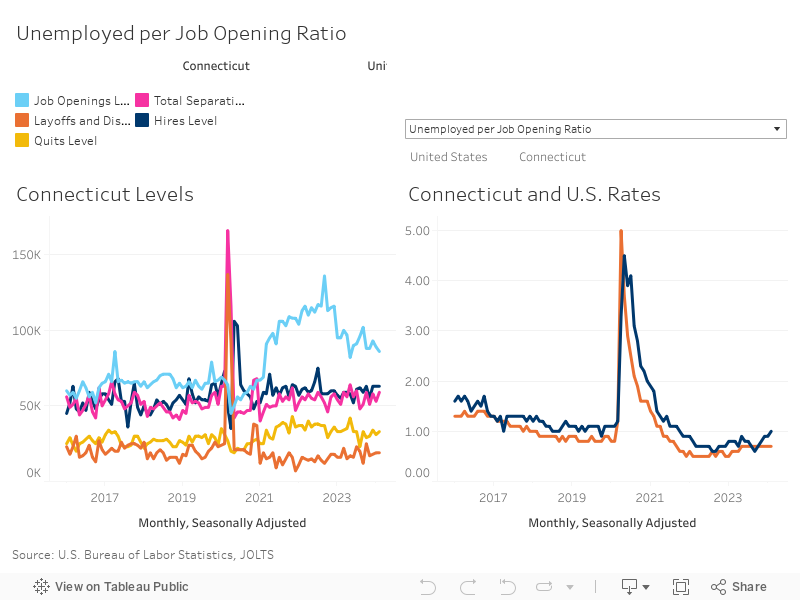
Job Openings
Despite the labor shortages that both the state and the nation have experienced in the post-pandemic economy, Connecticut’s labor market continues to have a slightly less tight labor market. Unemployed per job opening, an important measure of labor market tightness, was 1.0 in CT compared to 0.7 in the nation overall for the month of February, suggesting a greater availability of labor. Overall, hire rates, job postings rates, quits rates, and layoff rates remain relatively close to the national trends overall, suggesting the state continues to follow the strong labor trends being experienced nationally.
Data Published: April 17, 2024
Next Release: May 17, 2024
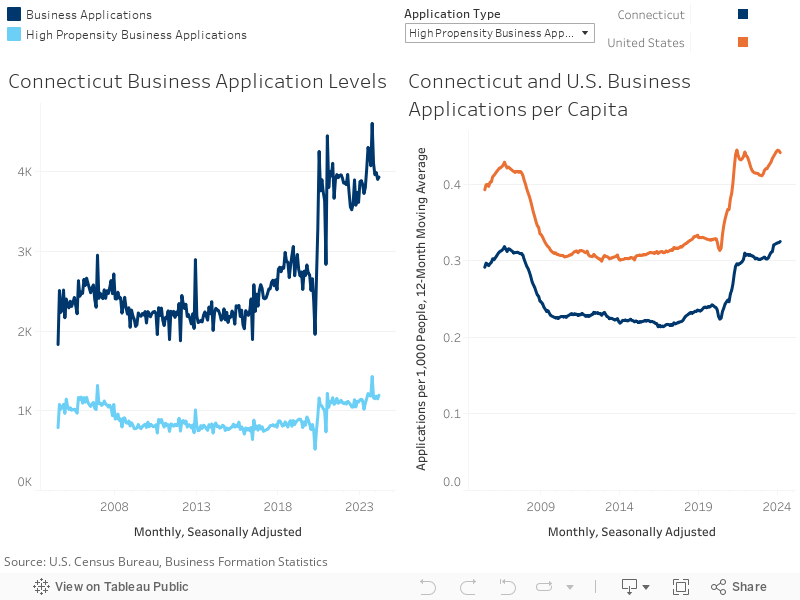
Business Formation Statistics
The post-pandemic economy has seen a significant increase in business applications both in Connecticut and nationally. Business applications, both general applications and high propensity business applications, are at all-time highs in CT for the measurement period. In recent months, high propensity business applications per capita have begun to decline at the national level while they are seen a slight uptick in CT. The gap between business applications per capita between the US and CT has remained relatively constant over the past 16 years. For high propensity businesses this equals roughly 1 fewer application per 10,000 residents.
Data Published: April 11, 2024
Next Release: May 9, 2024
Opportunity and Inclusion
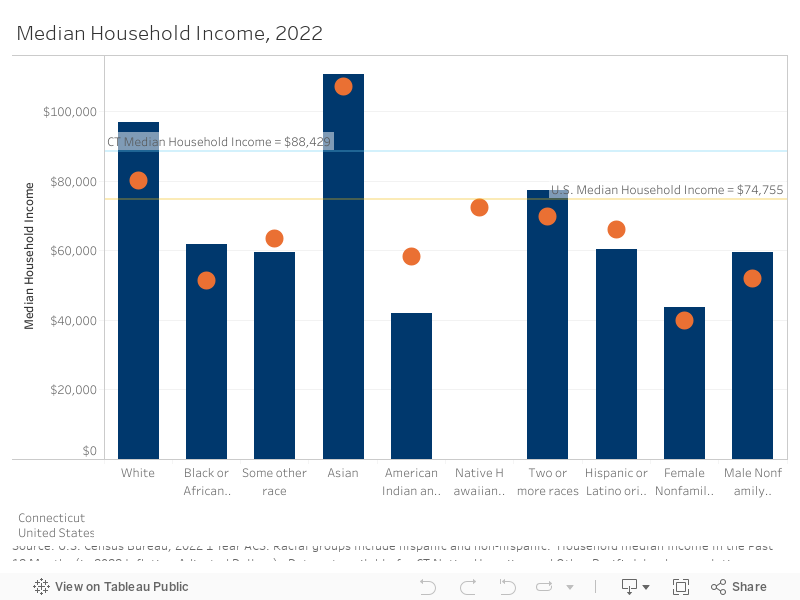
Household Income
Median Household Income in Connecticut ($88,429) is significantly higher than the national level ($74,755), though notable disparities exist within the state. Households of White, Black, Asian, and Two or More Races in Connecticut earn more than their counterparts nationally. However, Connecticut median household incomes are lower than U.S. levels for those of Hispanic or Latino Origin (of any race), as well as for American Indian and Alaska Native, and those of Some Other Race. The gap between CT and U.S. income for Hispanic or Latino and Some Other Race populations in CT is smaller than last year, a positive consequence of better than national income growth overall from 2021 to 2022. Data is not available for Native Hawaiian and Other Pacific Islander populations in CT for 2022. The Male-Female median household income gap is larger, both in absolute and percentage terms, in Connecticut than the nation.
Focusing on growth, Connecticut's median household income grew 3.5% over the last five years and 3.9% in the last year, ranking 28th and 7th among states respectively. This recent change is indicative of more competitive income growth than in previous years.
Data Published: September 14, 2023
Next Release: Fall 2024
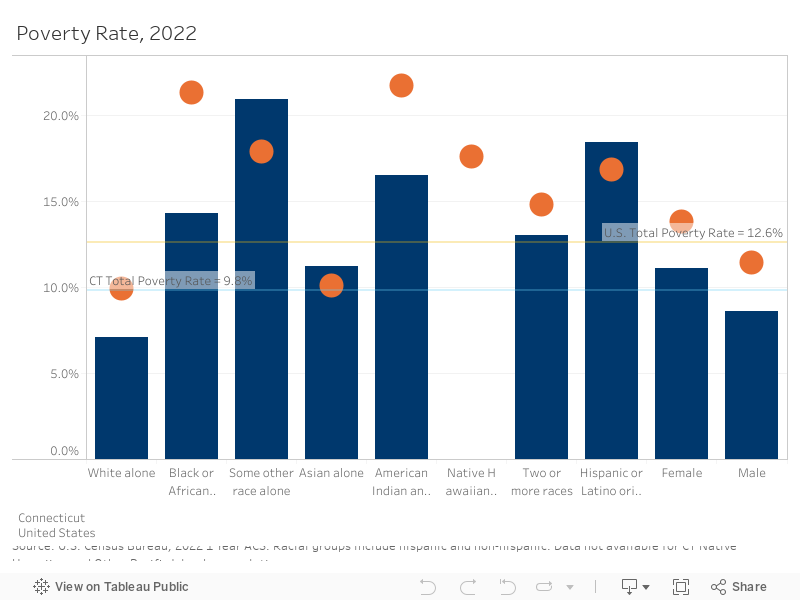
Poverty
Poverty is less prevalent in Connecticut (9.8%) than in the nation (12.6%). This extends to most demographics except Asian alone, Some Other Race Alone, and Hispanic or Latino populations. Data is not available for CT Native Hawaiian and Other Pacific Islander populations.
Since 2021, CT has reduced poverty slightly more than the nation. These reductions extend across most demographics, the largest being a 3.1% reduction in poverty among CT American Indian and Alaska Native populations. Rates increased for CT Female and Asian populations. The latter rose by 3.8% to shift Connecticut's Asian poverty rate above national.
Data Published: September 14, 2023
Next Release: Fall 2024
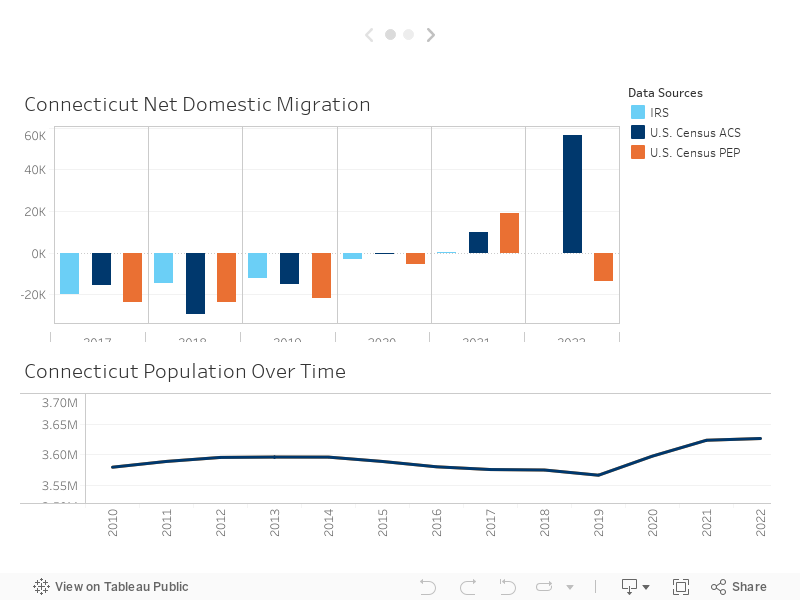
Population and Migration
Connecticut’s population has increased since 2020, after having been flat (2013-2014) or declining (2015-2019) over most of the past decade. By 2020 Connecticut had regained all the population lost during the prior 5 years, and the state has continued to grow in 2021 and 2022.
This population change aligns with a shift from negative to positive net domestic migration beginning in 2020/2021. Connecticut’s migration patterns have been improving (becoming less negative) since 2018 and most data sources show a flip to positive (net in-migration) since the pandemic.
Note: Some of the 2021-22 out-migration shown in the PEP data may stem from temporary covid induced relocations, as this data set also saw a larger “pop” in in-migration in 2020-21 than the other sources. Netting the inflow in 2021 and the outflow in 2022 results in a net gain of residents to Connecticut over that time frame. PEP data is calculated from July of the prior year to June of the current year, so the timing is slightly different from the other data sources. Census ACS, which was released in September, shows an net inflow of 56,582 residents. IRS have not yet released 2022 data. The level of in-migration varies between sources, which have different methodologies and include different populations.
Connecticut’s population is becoming increasingly diverse. Over the past 10 years, increases in Black, Asian, and populations of Two or More Races outpaced decreases in white populations, and the Hispanic population has grown significantly. The 65+ and 18-24 age groups have shown the largest increase in absolute and percentile terms over the last five and ten years.
Data Published: ACS - September 14, 2023; PEP - December 2023; IRS - April 27, 2023
Next Release: ACS - Fall 2024; PEP - December 2023; IRS - Spring, 2024
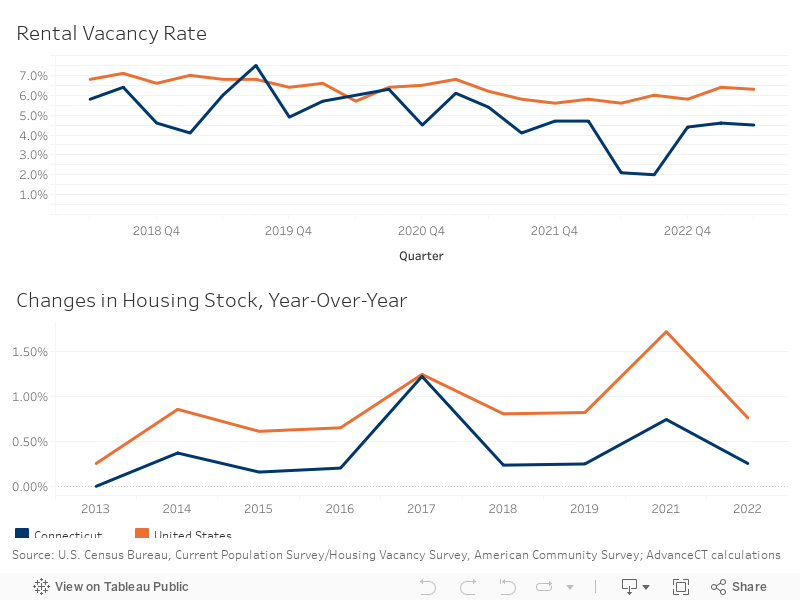
Housing
Connecticut's rental vacancy rate has been lower than the US over most of the past 5 years, indicating a tighter housing market and lower availability of rental units. This disproportionately impacts young workers (under 35), unmarried individuals, and non-white households, all of which are more likely to rent. (Pew, 2021)
Over the past 10 years, Connecticut's housing supply has grown more slowly than the US.
Data Published: Housing Vacancies and Homeownership (CPS/HVS) - August 03, 2023; Housing Stock (Census ACS) - September 14, 2023;
Next Release: Housing Vacancies and Homeownership (CPS/HVS) - October 31,2023; Housing Stock (Census ACS) - Fall 2024