
Using JOLTS Data to Understand Regional Labor Markets
How to assess the availability of workers, estimate how long it may take to hire, and understand the degree of competition for talent in a regional labor market.
January 2024 — 4 minute read
By Waverly Langston, Rachel Gretencord, Jessica Jackson, Dustin Nord, and Benjamin Iannuzzi
What is JOLTS?
JOLTS refers to the Job Openings and Labor Turnover Survey, conducted monthly by the U.S. Department of Labor Bureau of Labor Statistics (BLS). The data from JOLTS is probably less familiar to readers than other economic measures such as the unemployment rate. However, JOLTS offers valuable labor market information for businesses, such as how difficult it may be to hire and how much employment turnover is happening. This article includes a brief overview of the JOLTS survey, the resulting data, and how it is best interpreted.
About the Survey
Each month, the BLS surveys approximately 21,000 business establishments (locations of payroll) of all sizes across all 50 states and Washington D.C. Information is gathered for public and private sectors in all nonagricultural industries. JOLTS provides data for hires, job openings, layoffs and discharges, quits, other separations, total separations, and an unemployed persons per job opening ratio. (See Appendix for definitions.) Except for unemployed persons per job opening ratio, all data points are available as a level and rate. Level indicates the actual value (e.g., number of hires that month) while rate represents that value as a share of total employment. Levels are useful for looking at a specific region, particularly over time, while the rates add context that allows for comparisons between regions. BLS also offers seasonally adjusted data which account for normal changes during the year. Certain data points, including industry, establishment size (number employees at that location), and other separations, are provided only at the national level and are not calculated at the state or regional level.
Interpreting JOLTS Data
The BLS refers to JOLTS data as ‘demand-side’ indicators of the labor market. Two data elements speak directly to demand. Hires is the first, looking at how many new employees establishments took on each month. Job openings is the second and is particularly useful as it provides a forward-looking measure of unmet demand for labor. These data points can be used in different ways to assess labor market conditions.
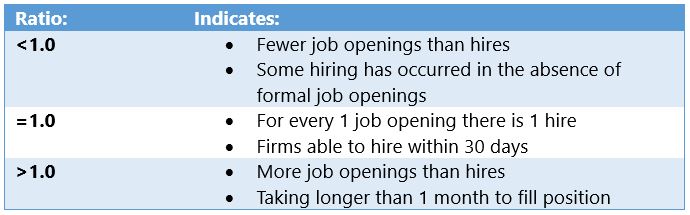
First, the ratio of job openings to hires can be indicative of how long it takes to fill an open position. A ratio of one indicates for every job opening there is one hire, and firms are generally able to hire within 30 days. Ratios greater than one mean there are more job openings than hires, and the greater the ratio, the longer on average it takes firms to hire.
Job Openings/Hires1
Second, job openings data can be used to assess labor market ‘tightness.’ The job openings rate, which is job openings divided by the sum of job openings and employment2, points to the portion of desired jobs that are unfilled. A higher ratio of available jobs suggests workers have lots of options for new employment, a more favorable labor market for workers. The ratio works in the other direction from an employer’s perspective; many open jobs indicates greater competition for talent.
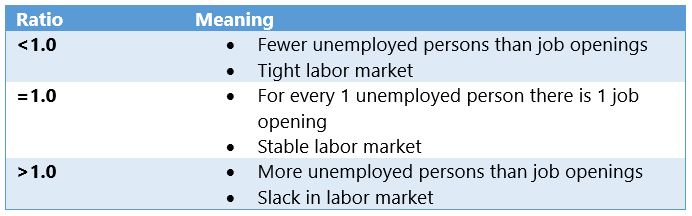
Third, the unemployed persons per job openings ratio expresses the relationship between supply (unemployed people) and demand (job openings). Values less than one suggest a tight labor market with more job openings than unemployed workers, while ratios larger than one indicate slack with more unemployed workers than available jobs.
Unemployed Persons/Job Openings
The data points described above are good preliminary indicators of labor market conditions, but it is also important to contextualize these measures for a more thorough understanding. This can be done by looking at greater detail within the JOLTS measures, or by examining a region in comparison to other regional or national data.
Assessing a metric within the context of other JOLTS data can provide for better understanding of the labor market. For example, a high number of job openings may indicate strong unmet demand for workers; but it could also indicate high ‘churn’ if hires and quits are also elevated. When employee turnover is high, job openings, quits, and hires all increase as workers leave for new positions and companies look to backfill those empty positions. In another example, looking at the relationship between quits versus layoffs and discharges as a portion of total separations can also be insightful. Quits tends to make up a higher share of total separations as the labor market gets stronger while layoffs and discharges increases as the economy weakens.
Using rates to compare labor markets between different regions can also provide useful context. For example, during the tight labor market that occurred post-pandemic, Connecticut’s unemployed worker per job opening was much lower than it had been historically, but was higher than most of the U.S., indicating that while there were fewer available workers than prior time frames, the labor market crunch was less dire in Connecticut than in other regions of the country. Additionally, Connecticut’s quits rate during this period was lower than the U.S. average, indicating a more stable workforce for employers than elsewhere.
Using JOLTS metrics in this way adds valuable detail to a regional labor market analysis. Businesses can determine the relative availability of workers, estimate how long it may take to hire, and understand the degree of turnover and competition for talent. These metrics can be a good starting point for understanding the regional labor market.
Appendix:
Data Definitions:
Hires is defined as all additions to the payroll. That includes newly and rehired employees regardless of permanency, full or part time work, and transfers to other locations. Excluded are returns from strikes, transfers within the same location, and employees of temporary help agencies, employee leasing companies, outside contractors, or consultants working at the establishment.
Job Openings includes all positions open on the last business day of the month that meet three criteria:
- A specific position exists with work available.
- The job could start within 30 days.
- The employer is actively recruiting workers from outside the establishment to fill the position.
Layoffs and Discharges includes separations initiated by the employer.
Other Separations includes retirements, transfers to other locations, and separations due to disability or death. This data point is only available at the national level, not state or regional.
Quits includes employees who left voluntarily except for retirements or transfers to other locations.
Total Separations includes all separations mentioned above: Quits, Layoffs and Discharges, and Other Separations.
Unemployed Persons Per Job Opening is a calculated value that divides the number of unemployed people by the number of job openings in that region during a particular month. Unemployment comes from the Current Population Survey (CPS) and Local Area Unemployment Statistics (LAUS); both are BLS surveys.
All data are reported monthly, unless indicated otherwise.
Establishment Size Classes:
(Only available for national level data)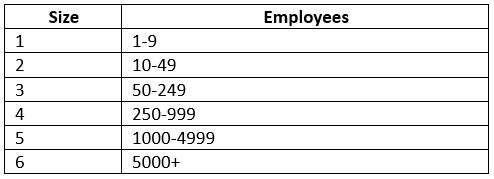
Sources and Further Reading:
This information along with additional detail, complete methodologies, data downloads, and summary publications, can be found on the BLS website.
BLS Website, Jolts Homepage: JOLTS Home: U.S. Bureau of Labor Statistics (bls.gov)
BLS Website, Handbook of Methods, JOLTS Overview: Overview: Handbook of Methods: U.S. Bureau of Labor Statistics (bls.gov)
1Bauer, Lauren, et al.; “A Closer Look at a Hot Labor Market,” The Hamilton Project, Brookings, October 2022: https://www.brookings.edu/wp-content/uploads/2022/10/Hamilton-Project-A-Closer-Look-at-a-Hot-Labor-Market.pdf.
2Employment data for this metric comes from the BLS’ Current Employment Statistics (CES) survey.