
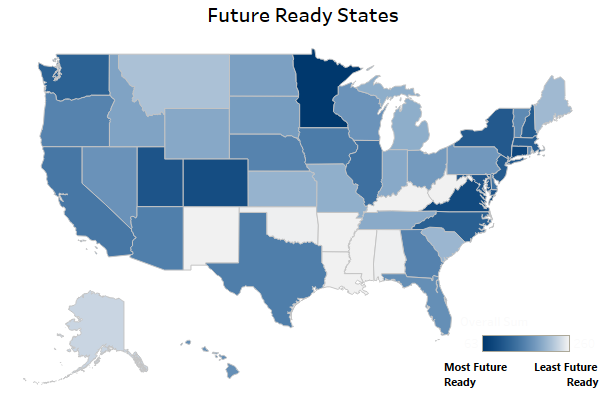
Future Ready States
A ranking that assesses states’ ability to provide an environment conducive to business growth, based on the priorities of site selectors and business leaders and the market trends that shape business relocation and expansion decisions.
November 2023 — 12 minute read
By Rachel Gretencord, Jessica Jackson, Waverly Langston, and Dustin Nord
Introduction
When a business makes a location decision, it is usually a long-term commitment. Talent will put down roots in an area and may be reluctant to move again; custom buildings and equipment are difficult or costly to move or replace; and business and supply chain networks and logistics will take time to re-establish. Therefore, before making significant location investments, companies want to ensure they are choosing a location that will provide a solid foundation for long-term growth. As part of the decision-making process, leaders with foresight must consider factors that impact the region’s future economic and business environment.
Similarly, states must consider the long-term economic and business impacts of their investments. Positioning regional economies for future success requires ongoing development of a skilled labor force, strategic long-term policy decisions, and effective management of resources. Furthermore, the increasing frequency of unexpected events, from climate driven hazards to public health emergencies and geopolitical unrest, means states also need to be prepared for possible economic shocks. Elected leaders and other stakeholders need foresight to ensure their regions’ long-term economic stability.
These considerations inspired the development of the Future Ready States index. Future Ready States provides a benchmark for assessing which states are working to address these long-term challenges and lay the groundwork for future economic success.
The index includes seven categories that industry leaders frequently investigate when making their location decisions:
- Quality Workforce
- Building the Future Workforce
- Innovative Economy
- Infrastructure
- Government Stability and Regulatory Environment
- Clean Energy and Climate Policy
- Livability and Equity
Methodology
The Future Ready States index is comprised of 52 unique data points, collected from more than a dozen reputable primary sources. (See Appendix A for a comprehensive list of sources.) Once the data were collected, state rankings were produced for each metric. In some cases, a group of related metrics were combined into one subcategory to avoid disproportionately emphasizing a particular area1. Metrics or subcategories were scaled for comparability where appropriate2 and were weighted equally within each category. The final ranking reflects the composite score that each state received in the index. Indicators were selected based on the top concerns of site selectors and companies making a location decision, as well as factors related to long-term economic vitality, resilience, and endurance.
Results
A number of factors impacted the 2023 Future Ready States rankings. As workforce is a primary driver of economic vitality, endurance, and resilience, shifts in remote work policies following the pandemic provided small- and mid-sized metros with an opportunity to absorb talent from large coastal hubs3. Many of the traditional economic centers have faced increasing challenges such as poor housing availability, high costs, and sharp inequality among communities within regions in recent years4,5. In addition, there is a growing trend for businesses and workers to opt for relatively less expensive locations, seeing future economic activity as more viable outside large economic hubs6,7,8,9.
First, the ratio of job openings to hires can be indicative of how long it takes to fill an open position. A ratio of one indicates for every job opening there is one hire, and firms are generally able to hire within 30 days. Ratios greater than one mean there are more job openings than hires, and the greater the ratio, the longer on average it takes firms to hire.
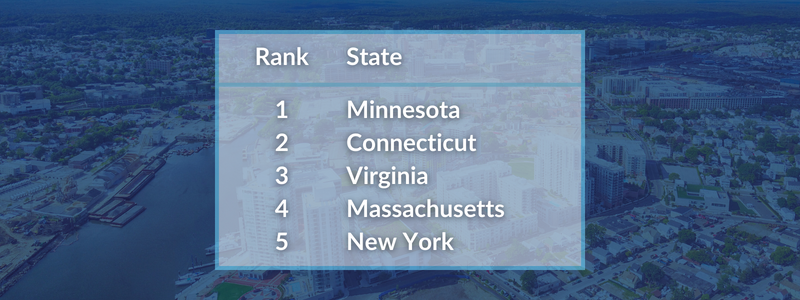
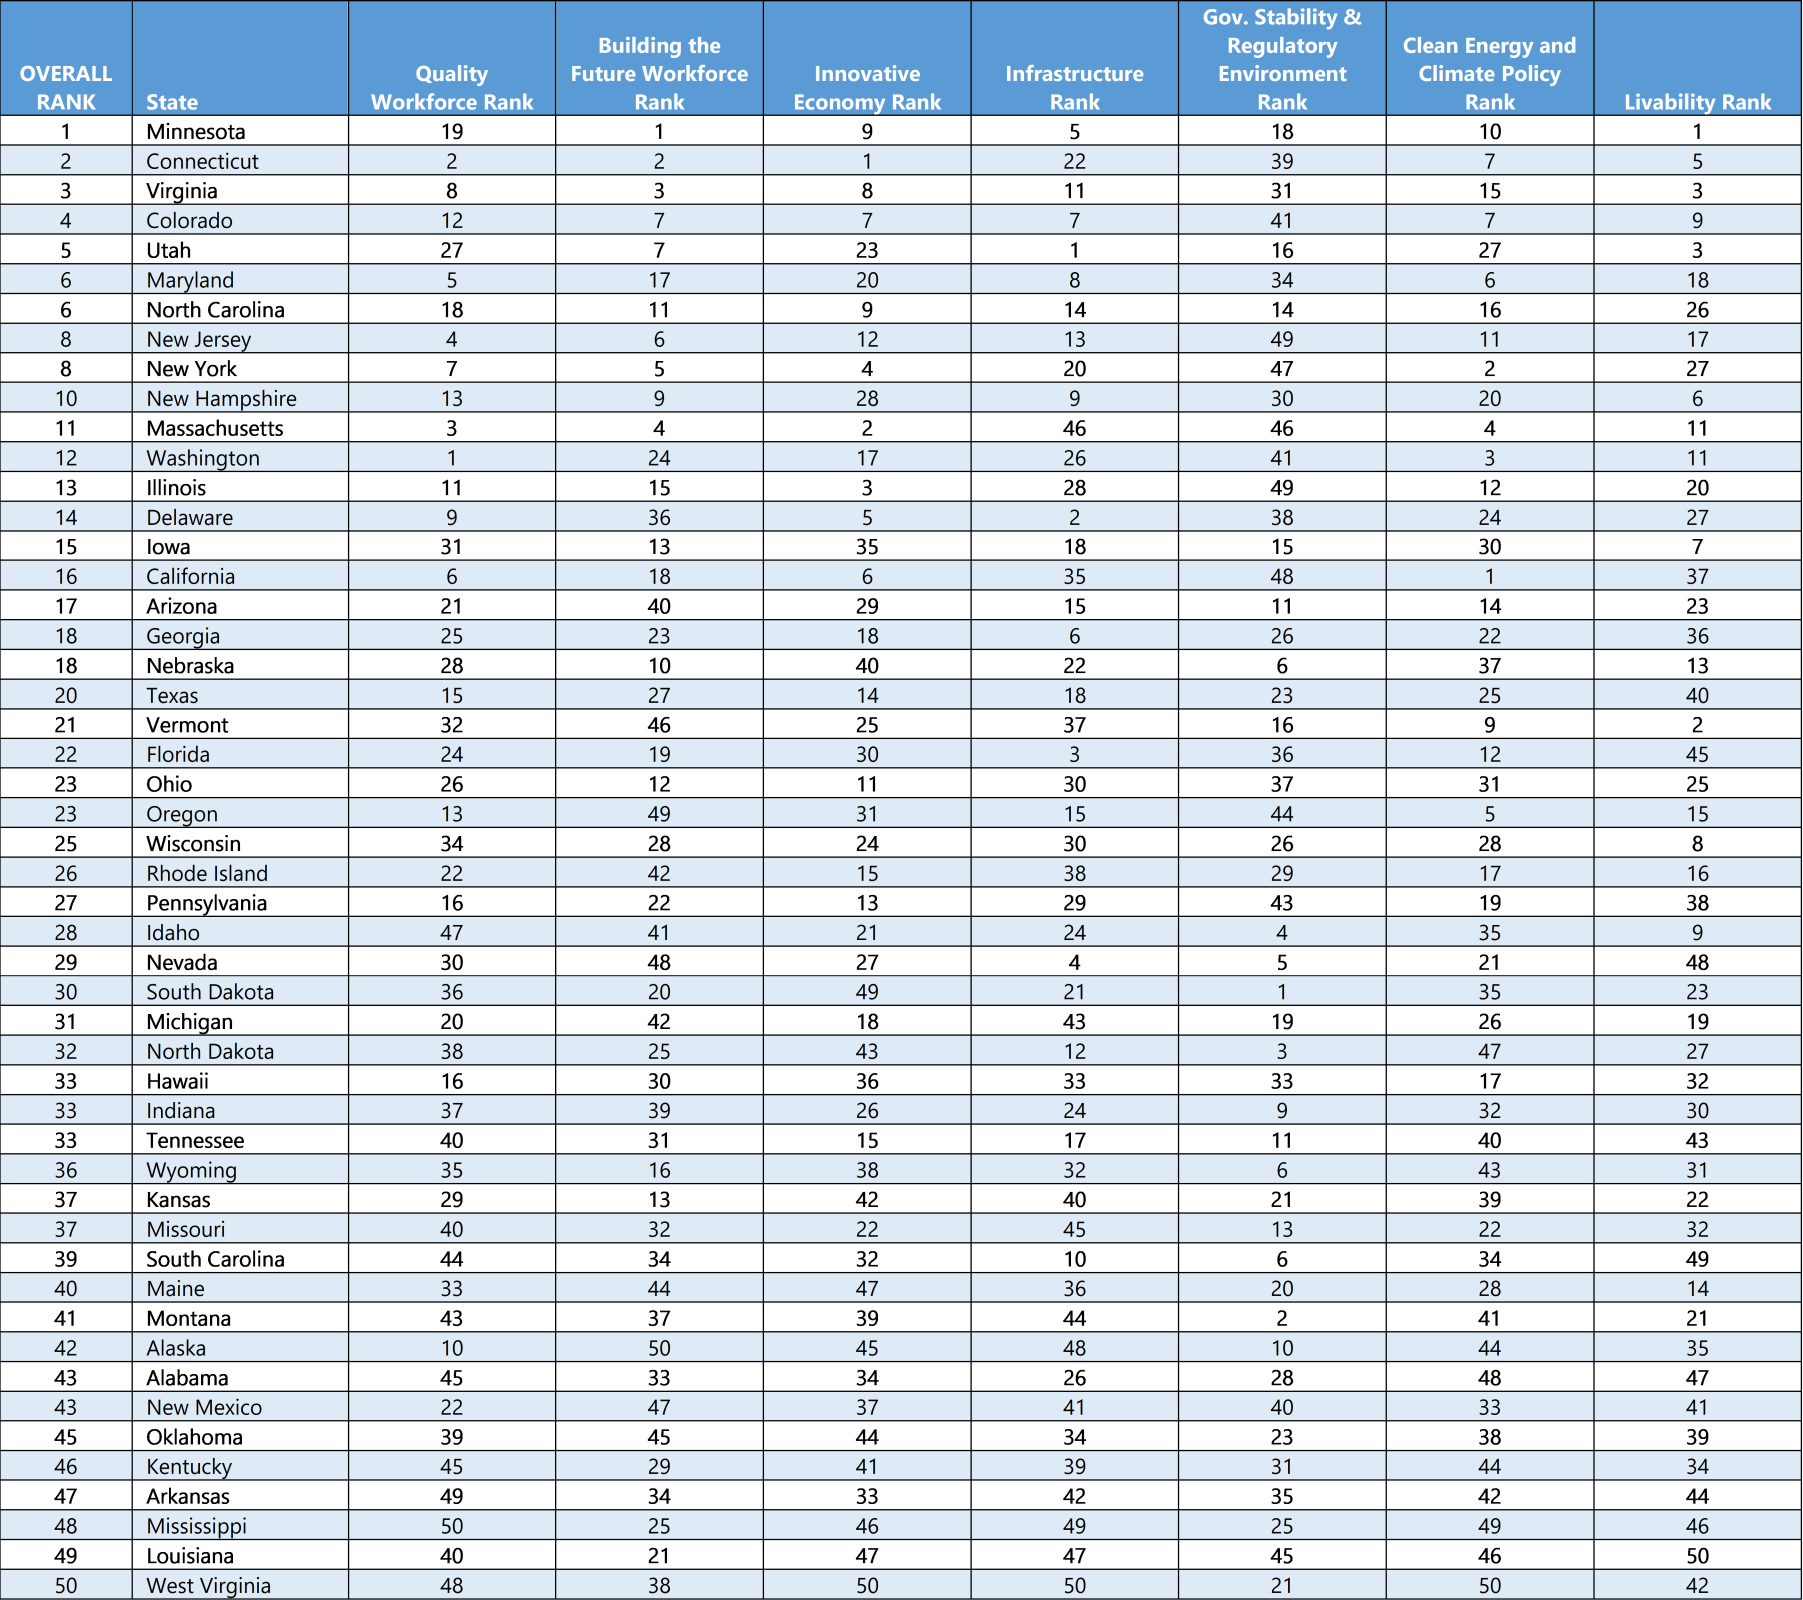
Minnesota took the top spot in this year’s ranking, with solid performance across a range of categories. This top billing was driven by Minnesota’s #1 ranking in the Building the Future Workforce and Livability and Equity categories, as well as a top five place for Infrastructure. The state was also among the top ten states in the Innovative Economy and Clean Energy and Climate Policy categories.
Connecticut and Virginia came in second and third, respectively. Both states ranked in the top ten for Quality Workforce, Building the Future Workforce, Innovative Economy, and Livability and Equity. Connecticut also had a top ten placement for Clean Energy and Climate Policy.
Rounding out the top five were Colorado and Utah. Both states reached the top ten in the Building the Future Workforce, Infrastructure, and Livability and Equity categories. See Appendix B for the full rankings list.
Rankings by Category
Quality Workforce
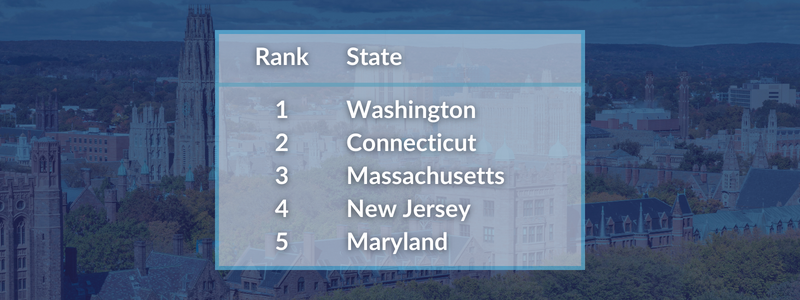
Talent is arguably companies’ number one concern. With recent worker shortages across the U.S., companies are moving to where skilled, productive talent is located. Increasingly, companies are also looking for high concentrations of STEM talent and global connections10. Even before the current workforce crunch, it was well established that a location’s economic resilience depended on productivity, and negative economic shocks are less impactful in places where more households have multiple sources of income and higher savings and wealth11. Higher income, wealth, and savings are also associated with higher educational attainment12. As such, the Quality Workforce metrics in the Future Ready States ranking focus on educational attainment, workforce productivity, and talent availability, both overall and specifically as relevant to STEM occupations and global in-migration.
The highest performing states in this category did well across a range of metrics. Washington took the top spot, largely driven by a high concentration of STEM occupations, workforce productivity and availability, and attraction of global talent, with the state placing in the top 5 in each category. Connecticut and Massachusetts scored second and third, respectively, and were both in the top ten for all metrics but one each. New Jersey came in fourth with a tight score cluster between 6th and 11th on all metrics while Maryland secured fifth place by placing among the top 10 scores for all metrics except labor force availability.
Top Ranked States for Quality Workforce
Building the Future Workforce
Because talent is so crucial to economies, a region’s talent pipeline is also pivotal to maintaining a quality labor force over a longer time frame. Company leadership taking a long-term view regarding their location decision will frequently inquire about educational systems—both for programs of study relevant to their company’s most essential or difficult-to-hire talent as well as for their employees’ own children. Furthermore, regions investing in their youth are viewed as more prepared to weather shifting economic conditions. Thought leaders from the national13 to the local level14 have weighed in on the need to invest in our young people.
Though lifelong learning is important, the metrics in the Building the Future Workforce category concentrate on a state’s investment in the next generation of its workforce—quality and outcomes of early childhood through secondary school education, vocational school availability, and outcomes and earnings for young professionals.
Minnesota was the highest-ranking state in the Building the Future Workforce category, with solid performance across the board. The state came in between 8th and 14th on every metric in this category. Connecticut, Virginia, and Massachusetts, on the other hand, scored highly for college preparation, early childhood education, school quality, and youth wages, but performed less well for vocational school availability. New York, similarly, did well in the college preparation, school quality, and youth wages categories.
Top Ranked States for Building the Future Workforce
Innovative Economy
Innovation is widely cited as one of the most important components of long-term economic growth. New technology and processes increase efficiency and workforce productivity; higher quality products and services create new revenue streams and increase quality for consumers15. Innovation can also impact factors such as sustainability16 and social equality17. Businesses making a location decision—especially those developing novel technologies—often benefit from close proximity to their investors and funders. The Innovative Economy category aims to measure the presence of an innovative ecosystem, with indicators such as concentration of innovative firms, funding and investment, and technology transfer markers such as patent activity serving as signals that the region’s economy can grow and adapt over the long term.
The most innovative state, Connecticut, ranked in the top 10 for all subcategories of Innovative Economy except new business development. Massachusetts came in second, but with slightly lower rankings for new business development and FDI attraction. Performance for Illinois (3rd) and New York (4th) varied significantly between metrics, though Illinois was in the top 5 for FDI attraction and Fortune 1000 companies per capita and New York hit the top 10 for patent activity, Fortune 1000 companies and new business development. Despite scoring higher than Connecticut for patents, Fortune 1000 headquarters, and new business creation, Delaware’s lower scores for R&D funding and FDI attraction brought it to 5th place.
Top Ranked States for Innovative Economy

Infrastructure
Regions primed for economic growth should possess vital infrastructure to transport materials to factories, finished products to market, and workforce to job sites. Positive impacts from high quality infrastructure range from efficiency and safety, to less-frequently cited but perhaps equally important benefits including decreased environmental impact, job creation, FDI, and increased revenue collection18. Closing the digital divide is also critical19, and productivity after natural disasters is dependent on infrastructure efficiency20. Conversely, poor infrastructure can create inefficiencies in production processes. The indicators included in this category—electrical infrastructure, transportation infrastructure, broadband access, and housing construction—all influence a business’s ability to produce, deliver, or expand production and accommodate an appropriate workforce.
States investing in quality infrastructure will be better-positioned for long-term growth.
Measuring Infrastructure quality introduces a group of states largely unseen in the top 5 so far. Utah’s success in this category is largely driven by its high quality and safe transportation infrastructure, while Delaware secured the #2 slot with high quality broadband. Neither of the top two states scored below 13th in any subcategory. Third place goes to Florida for good electrical infrastructure and construction of housing to meet future demand. Nevada came in 4th, with stable electrical infrastructure and quality roads and bridges. Minnesota secured the 5th place spot.
Top Ranked States for Infrastructure

Government Stability and Regulatory Environment
Stability and predictability are critical components of long-term business growth. Rule of law, strong institutions, a responsive and efficient bureaucracy, and low corruption contribute to a business climate that is conducive to investment21. States who overregulate their economies can cause higher consumer prices and create barriers to entry for new businesses22.
Furthermore, macroeconomic resilience affects the ability of a state to cope, recover, and reconstruct, if necessary, after natural disasters or during economic downturns23. As policymakers engage in fiscal planning, they must consider whether their state is sufficiently prepared for unexpected shocks like recessions or natural disasters24. Future Ready States includes indicators that show how much regulation states impose on businesses and residents, and how fiscally prepared they are for current and future economic disruptions.
South Dakota won this category by a significant margin with the strongest fiscal health and second fewest regulatory restrictions. The four remaining top 5 states were all very close. Montana (2nd), North Dakota (3rd), and Nevada (5th) scored in the top ten for regulation and fiscal stability while Idaho (4th), lowest of the group at 14th for stability, came in first for number of restrictions.
Top Ranked States for Government Stability and Regulatory Environment

Clean Energy and Climate Policy
Climate change is one of the major causes of natural disasters that can have devastating effects on businesses and economies. Physical and weather risks, and large shifts in asset value are two of the ways climate change could cause significant business and economic disruption25.
Climate change will also continue to increase the demand for energy in the future, with impacts on both businesses and residents26 — and states with hotter climates will see larger increases in energy demand (see image).
States that are future ready are working now to reduce their carbon footprint and mitigate the impending impacts of climate change. The Future Ready States index includes metrics on transportation modes that reduce fossil fuel reliance, climate policy efforts, and state carbon emissions.
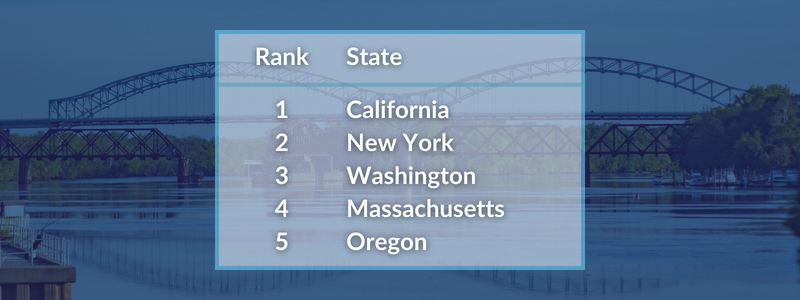
States that performed well for Clean Energy and Climate Policy did so consistently—each of the top 5 states in this category ranked in the top 10 in every subcategory. California, with top rank for progress towards zero-carbon, number two in transportation, and third for economic carbon intensity, was secure in taking first place for the category. In second place, New York scored best for energy intensity of the economy while Massachusetts’ fourth place was bolstered by a number one ranking in transportation.
Projected Changes in Median Energy Expenditures by 2080-2099
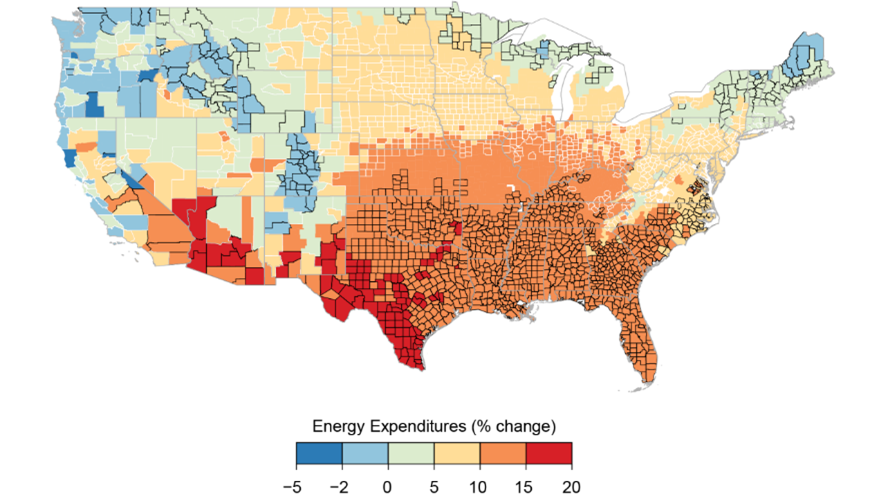
Source: NOAA U.S. Global Change Research Program, 2018
Top Ranked States for Clean Energy and Climate Policy
Livability and Equity
Talent attraction is vital to a state’s workforce in the long term. Affordability, ability to live proximate to work, safety, health, and equality all play a role in attracting talent. Though all the aforementioned factors are important to more than talent attraction, there is long standing evidence that economies with higher inequality across populations are less resilient27.
One of the reasons is that low-income populations are more vulnerable to the effects of natural disasters and economic disruptions than are those with higher incomes28.
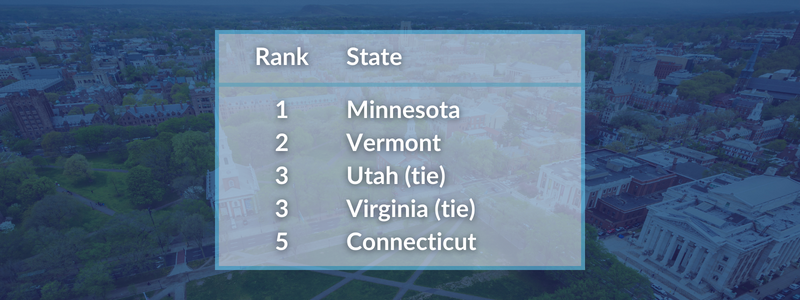
Minnesota makes another appearance at the top of the Livability and Equity category, again scoring in the top 10 for every subcategory. Vermont performed well in all subcategories except for cost of living. Virginia and Utah tied for 3rd, generally flip flopping for performance in different categories. Connecticut makes another appearance with top 5 performance for Crime, Health, and Equality making up for lower cost of living scores.
Top Ranked States for Livability and Equity
Conclusion
The Future Ready States ranking highlights states that are best positioned for long-term business and economic success. The focus on metrics that have been deemed significant by industry leaders means that these results are not simply theoretical, but grounded in practical experience. This ranking also illuminates the advantages and disadvantages that each state has relative to future readiness. While Minnesota, Connecticut, Virginia, Colorado and Utah may have taken the top spots, states across the country and in each region excelled in various ways. It’s our hope that companies, site selectors, and policy makers can use these results to make informed decisions as they execute their long-term visions.
Appendix A
Sources and Metrics
Data was gathered until September 1, 2023. Analysis incorporates the most recent data available at the time of collection.
Quality Workforce
Building the Future Workforce
Innovative Economy
Infrastructure
Government Stability Regulatory Environment
Clean Energy and Climate Policy
Livability and Equity
|
Appendix B
Full Rankings
1Bauer, Lauren, et al.; “A Closer Look at a Hot Labor Market,” The Hamilton Project, Brookings, October 2022: https://www.brookings.edu/wp-content/uploads/2022/10/Hamilton-Project-A-Closer-Look-at-a-Hot-Labor-Market.pdf
2Employment data for this metric comes from the BLS’ Current Employment Statistics (CES) survey
3Florida, Richard, et.al. “Heartland of Talent: How Heartland Metropolitans are Changing the Map of Talent in the U.S.” Heartland Forward, 2022. https://heartlandforward.org/case-study/heartland-of-talent-how-heartland-metropolitans-are-changing-the-map-of-talent-in-the-u-s/
4Florida, Richard. “The New Urban Crisis.” Basic Books, 2017
5Liew, Amy, et al. “Making local economies prosperous and resilient: The case for a modern Economic Development Administration.” Brookings, June 2022. https://www.brookings.edu/articles/making-local-economies-prosperous-and-resilient-the-case-for-a-modern-economic-development-administration/
6Konrad, Alex. “A Bevy of Billionaires Join Steve Case's $150 Million 'Rise Of The Rest' Startup Fund.” Forbes, 2017. https://www.forbes.com/sites/alexkonrad/2017/12/05/steve-case-raises-150-million-rise-of-the-rest-fund/?sh=5fbc5ca4362c
7Mischke, Jan, et al. “Empty Spaces & Hybrid Places.” McKinsey, July 2023. https://www.mckinsey.com/mgi/our-research/empty-spaces-and-hybrid-places
8Hegarty, Emelie. “The Rise of Mid-Size U.S. Cities: The Industrial Development Boom.” Area Development, Q3 2023. https://www.areadevelopment.com/corporate-site-selection-factors/Q3-2023/the-rise-of-mid-Size-US-cities-the-industrial-development-boom.shtml
9Hickey, David. “Mid-size Markets Competing for Business and Winning.” Area Development, Q1 2020. https://www.areadevelopment.com/economic-analysis/Q1-2020/mid-size-markets-competing-for-business-and-winning.shtml
10“H-1B Visa Program and Its Impact on the U.S. Economy.” American Immigration Council, July 2022, modified August 2023. https://www.americanimmigrationcouncil.org/research/h1b-visa-program-fact-sheet
11Hallegatte, Stephane. “Economic Resilience Definition and Measurement.” The World Bank Climate Change Group, May 2014, p 21-2
12Wolla, Scott A. and Sullivan, Jessica. “Education, Income, and Wealth.” Federal Reserve Bank of St. Louis, 2017. https://research.stlouisfed.org/publications/page1-econ/2017/01/03/education-income-and-wealth#:~:text=The%20relationship%20between%20education%20and,incomes%20(see%20the%20table)
13Athanasia, Gabrielle and Jillian Cota. “The US Should Strengthen STEM Education to Remain Globally Competitive.” Center for Strategic and International Studies, April 1, 2022
14“Connecting Our Future: 2020 Disconnected Youth Task Force Report.” City of New York, 2020, p. 9. https://www.nyc.gov/assets/youthemployment/downloads/pdf/dytf-connecting-our-future-report.pdf
15Rosenberg, Nathan. “Innovation and Economic Growth.” OECD, 2004. https://www.oecd.org/cfe/tourism/34267902.pdf. See also Sarangi, Ajoy K., et.al. “How Does Innovation Affect Economic Growth? Evidence from G20 Countries.” The Indian Economic Journal, Vol 70, Issue 1, Dec 9, 2021. https://journals.sagepub.com/doi/full/10.1177/00194662211063562
16Gualt, Fred and Soete, Luc. “Innovation Indicators.” Oxford Research Encyclopedia of Business and Management, 2022. https://oxfordre.com/business/display/10.1093/acrefore/9780190224851.001.0001/acrefore-9780190224851-e-331
17Snyder, Bill. “How Innovation Drives Economic Growth.” Insights by Stanford Business, June 24, 2019. https://www.gsb.stanford.edu/insights/how-innovation-drives-economic-growth
18Runde, Daniel F. “Quality Infrastructure.” Center for Strategic and International Studies, Jan 9, 2017. https://www.csis.org/analysis/quality-infrastructure
19Puentes, Robert. “Why Infrastructure Matters: Rotten Roads, Bum Economy.” Brookings, Jan 20, 2015. https://www.brookings.edu/articles/why-infrastructure-matters-rotten-roads-bum-economy/
20Hallegatte, Stephane. “Economic Resilience Definition and Measurement.” The World Bank Climate Change Group, May 2014, p. 31. https://documents1.worldbank.org/curated/en/350411468149663792/pdf/WPS6852.pdf
21Shepherd, Ben. “Political Stability: Crucial for Growth?” London School of Economics, n.d. https://www.lse.ac.uk/international-relations/assets/documents/dinam/Dinam.Shepherd.Ben.Political-Stability-Crucial-for-Growth.pdf
22Millsap, Adam A. “How Too Much Regulation Hurts America’s Poor.” Forbes, July 2019. https://www.forbes.com/sites/adammillsap/2019/07/23/how-too-much-regulation-hurts-americas-poor/?sh=24d34b96271f
23Hallegatte, Stephane. “Economic Resilience Definition and Measurement.” The World Bank Climate Change Group, May 2014, p. 31. https://documents1.worldbank.org/curated/en/350411468149663792/pdf/WPS6852.pdf
24Chapman, Jeff, et al. “How Today’s Surpluses Can Help States Invest in Budget Stability.” Pew, April 2023. https://www.pewtrusts.org/en/research-and-analysis/articles/2023/04/13/how-todays-surpluses-can-help-states-invest-in-budget-stability
25“The Economics of Climate Change.” Swiss Re Institute, April 22, 2021. https://www.swissre.com/institute/research/topics-and-risk-dialogues/climate-and-natural-catastrophe-risk/expertise-publication-economics-of-climate-change.html
26“Climate Change Impacts on Energy.” U.S. Environmental Protection Agency, last updated May 2023. https://www.epa.gov/climateimpacts/climate-change-impacts-energy#26foot
27Hallegatte, Stephane. “Economic Resilience Definition and Measurement.” The World Bank Climate Change Group, May 2014, p. 32. https://documents1.worldbank.org/curated/en/350411468149663792/pdf/WPS6852.pdf
28Hallegatte, Stephane. “Economic Resilience Definition and Measurement.” The World Bank Climate Change Group, May 2014, p.22. https://documents1.worldbank.org/curated/en/350411468149663792/pdf/WPS6852.pdf